A Practical Guide to Aggregating API Usage in Ace Data Cloud
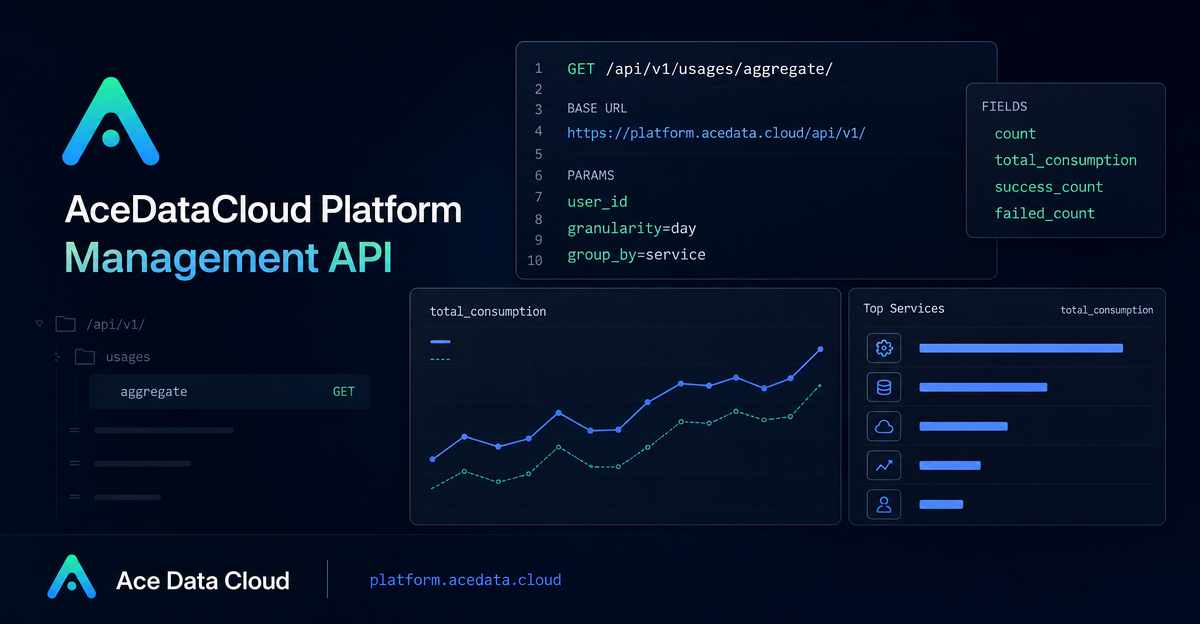
When an API-backed feature becomes part of a real product, the question quickly changes from “did the call work?” to “what is using quota, when, and why?” Raw request logs are useful for debugging a single request, but they are a noisy way to understand daily trends, service-level spend, or which credential is responsible for most of the activity.
The AceDataCloud Platform Management API includes a usage aggregation endpoint for exactly this kind of operational view. Instead of querying individual usage records and summing them yourself, you can ask the platform for grouped call counts, total consumption, successes, and failures over a time range.
What you can do
The endpoint is useful when you want to build a small internal dashboard, generate a monthly usage report, or investigate whether one application, service, API, or credential is driving most of your consumption.
- Plot call volume and consumption over time with
group_by=time. - Rank services by usage with
group_by=service. - Compare application-level or credential-level usage with
group_by=applicationorgroup_by=credential. - Track reliability using
success_countandfailed_count.
The API returns aggregated rows, not raw events. That makes it a better fit for dashboards and scheduled reports than for per-request debugging.
How it works
The interface belongs to the AceDataCloud Platform Management API and uses the unified prefix https://platform.acedata.cloud/api/v1/. The usage aggregation endpoint is:
GET https://platform.acedata.cloud/api/v1/usages/aggregate/Authentication is done with an account token in the request header:
Authorization: Bearer platform-v1-92eb****629cThe required query parameter is user_id. Optional filters let you choose the aggregation shape and time window:
granularity:hour,day,week, ormonth. The default isday.start_atandend_at: ISO8601 datetime strings.application_id,service_id, andapi_id: UUID filters.group_by:time,service,application, orcredential. The default istime.
Build a daily usage trend
For a product dashboard, the simplest view is a daily time series. It gives you enough resolution to spot abnormal days without drowning the reader in raw records.
USER_ID="89518d07-5560-4b05-92c1-667f3ddf6a4b"
PLATFORM_TOKEN="platform-v1-92eb****629c"

curl "https://platform.acedata.cloud/api/v1/usages/aggregate/?user_id=${USER_ID}&granularity=day&start_at=2026-03-26T00:00:00Z&end_at=2026-04-26T00:00:00Z"   -H "authorization: Bearer ${PLATFORM_TOKEN}"
With the default group_by=time, each row can include time, count, total_consumption, success_count, and failed_count. For example:
{
  "count": 30,
  "items": [
    {
      "time": "2026-04-01",
      "count": 1245,
      "total_consumption": 8.4521,
      "success_count": 1230,
      "failed_count": 15
    }
  ]
}
One practical detail: empty periods return an empty array rather than zero-filled rows. If you are drawing a chart, fill missing dates on the client side so the chart does not appear to skip time.
Find which service is driving usage
When the total line moves unexpectedly, the next question is usually “which service changed?” Switch group_by to service and keep the same time window.
curl "https://platform.acedata.cloud/api/v1/usages/aggregate/?user_id=${USER_ID}&group_by=service&start_at=2026-04-01T00:00:00Z" -H "authorization: Bearer ${PLATFORM_TOKEN}"Rows grouped by service can include service_id, service_title, count, total_consumption, success_count, and failed_count. A service ranking table is often more actionable than a raw log export because it immediately shows where to investigate.
Generate a monthly report with Python
For scheduled reporting, keep the request explicit: set the time range, choose a grouping dimension, and print the fields your team actually reads.
import requests

PLATFORM_TOKEN = "platform-v1-92eb****629c"
USER_ID = "89518d07-5560-4b05-92c1-667f3ddf6a4b"

resp = requests.get(
    "https://platform.acedata.cloud/api/v1/usages/aggregate/",
    headers={"authorization": f"Bearer {PLATFORM_TOKEN}"},
    params={
        "user_id": USER_ID,
        "group_by": "service",
        "start_at": "2026-04-01T00:00:00Z",
        "end_at": "2026-04-26T23:59:59Z",
    },
    timeout=20,
)

data = resp.json()
for row in data["items"]:
    print(
        f"{row.get('service_title', row.get('service_id', '?')):30s}  "
        f"Calls {row['count']:>6,}  Cost {row['total_consumption']:>10.4f}"
    )
This pattern is easy to adapt for group_by=credential when you need to understand which token or integration is creating most of the activity.
Operational details worth handling
There are a few edge cases worth baking into your implementation from the start. If granularity=hour is used, it only supports the last seven days; longer ranges are limited to day. The aggregation table is refreshed in batches, so the latest one to two minutes of calls may not appear immediately. If the API returns 400 with code invalid, check the value of granularity or group_by. A 401 with not_authenticated means the account token is missing. A 403 with permission_denied means user_id was not provided or does not match the current account.
For most builder workflows, this endpoint is the right layer between raw usage logs and finance reports: small enough to call from a script, structured enough for charts, and precise enough to answer “what changed?” without manually summing every request.
Read the full reference for the AceDataCloud usage aggregation endpoint here: Get AceDataCloud Platform API Usage Aggregate Stats.


Comments
Post a Comment